Top Post Views

3: Malaysia REITs - Looking For My 2nd Durian Runtuh
4: Is Insurance Really Necessary?
5: Everyone Must be A Millionaire

Head to the watch list on the above tab to see my what's on my radar and foreseeable future postings =)

Decided to make adjustments on the way I blog & share due to time constraints and other commitments. In the coming weeks you should see them. Short updates but more frequent & concise.

Wednesday, October 29, 2014

Budget 2015: Same Old Thing

Data sources: EPF's annual reports (KWSP), Ministry of Finance (MoF), Bank Negara Malaysia (BNM) and Auditor's General Report and Economic Planning Unit (EPU).

You may refer to my compiled sources here: Malaysian National Budget via Dropbox
No need to drill down the budget details - it's the same old thing. Only a few charts will do.

Spending more than we earn for a new record of 16 years in a row.


Hence we have been running fiscal deficits since the financial crisis of 1999.


Increased spending comes from ballooning operating expenditure. E.g. reckless handouts/promises of bonuses and etc. Development is sorely lagging behind.


Operating expenditure has now hit another new record high of 82% of our national budget allocation. Development expenditure is being squeezed hard. During Dr.M's time it was around 30s, PakLah's around 20s and now under Jib Goh it's 10s.


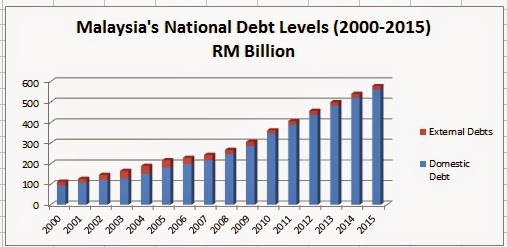
Persistent fiscal deficits are adding more and more to our total national debt further burdening future generations with ballooning national debt.


The country's national debt (domestic debt + foreign debt) is just short of its self-imposed ceiling of 55%. Very short = 0.02%.

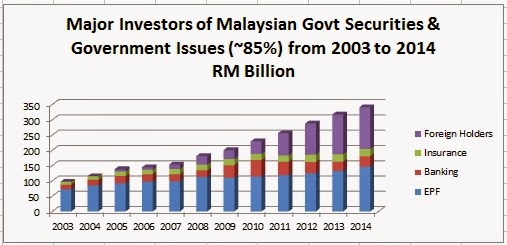
Nearly 30% of the national debt is held by the EPF and another 25% by foreign holders.

Contrary to the opposition party's opinion, I'm not worried about our debt to GDP ratio. This is because our debts are mainly domestic similar to Japan where its debt is 250% of GDP now although the high amount of foreign holders will leave our country's capital market more vulnerable to a sudden reversal of cross-border funds. However what is seriously more damaging is our persistently falling development/revenue ratio. Remember we are running deficits, if we minus out the deficit amount - almost every RM in the budget is used for operating expenditure only! Imagine this. You are earning RM 8,200. You have home utility bills of RM 8,200 and you got to pay them in full. You borrow RM 1,800 and that RM 1,800 is used to improve your livelihood. Seriously what a way to run the country. Bila nak bangun?

Monday, October 27, 2014

About Bonds - What? Buy, Sell or Hold?


I have been asked - What is a bond?
A financial instrument. More specifically it is a loan of money to either a company or government in return for a promise (not a guarantee because it can default) to pay you (the lender) a given rate of interest for a fixed period of time. e.g. usually measured in years (2 years, 5 years...maybe 10, 20 or even 30). This interest rate is often called the coupon rate while the date at which the issuer has to repay you the amount borrowed is called maturity date. 

Say you buy a bond from an issuer (say the government, in Malaysia it is called Malaysian Government Securities or MGS) with a face value of RM1000, a coupon of 4% and a maturity of 10 years. This simply means you'll receive a total of RM40 (RM1000*4%) of interest per year for the next 10 years. When the bond matures after 10 years, you will get your RM1000 back.

What most people don't know is that bonds are safer than equities (stocks/shares) ownership. A good example is when an issuer is a corporate one. A bond holder has higher claim on assets than shareholders do: that is, in the case of bankruptcy, a bondholder will get paid before a shareholder. However, the bondholder does not share in the profits if a company does well - he or she is entitled only to the principal plus interest. Therefore there is less risk in owning bonds than owning stocks but that comes at the cost of lower returns. 

Lastly the most confusing thing about bond is the price fluctuation which sets it apart from fixed deposit (the simplest form of financial instrument). The price fluctuate because bonds are publicly traded just like shares. When you buy the bond at par price (say RM1000), yield is equal to the coupon rate (interest), both at 4%. But if the price goes down to RM800, then the yield goes up to 5%. This happens because you are getting the same promised RM40 on an asset that is worth RM800 (RM40/RM800). Conversely, if the bond goes up in price to RM1200, the yield shrinks to 3.33% (RM40/RM1200).

In summary, if you are a bond buyer, you want high yields. This means buying bonds at a cheaper price. On the other hand, if you already own a bond, you've locked in your coupon rate (interest), so you hope the price of the bond goes up. This way you can cash out by selling your bond in the future.


More recently I have been questioned on my purchase timing of AmDynamic Bond as it is dishing out below expected historical returns.
First. What I want from bonds is at the bare minimum able to provide a return similar to a fixed deposit although the risk is higher. Bear in mind this is the 'bare minimum' and not the expected return which should always be slightly higher for the risk I'm taking. So far it has given me 3.28% year-to-year (since purchase) which is not far from a fixed deposit rate a year ago.

Second. The bond is meant to stabilize the overall portfolio. A bond can be compared to a defensive equity holding where the price will move up and down but you will get income along the way in the form of interest (in the comparison of equities from dividends). The bonds can do this kind of job (provide stability) if you own them and own them for the long term.

Third. Buying bonds in a potential rising interest rate environment is NOT counter productive towards returns. Rising rates push bond yields up and prices down. Longer-term bonds are generally more sensitive to rate hikes than shorter-term securities so holding short term ones are generally safer. Certain bond markets do well in this type of scenario. Higher yielding bonds and their fatter payout cushions the blow from rising rates while credit spreads should tighten as the economy gradually improves. Investors can have greater confidence in high-yield securities since a healthier global economy lowers the risk that such a marginal borrower will default. Once rate increases begin, bond investors have proven counterweights at their disposal and the most effective strategy may be to hold bonds or bond funds with staggered maturities, a tactic known as 'laddering'. A good fund house e.g. AmDynamic would employ such tactics as mentioned above.

I have said before and many times->Historical performance cannot be used as a perfectly accurate predictor towards future returns. Use it merely as a guide and reference.

***************************************************************
My five rules of choosing funds:
#1 Avoid choosing big sized popular funds!
#2 Compare fund expenses!
#3 Information on the fund manager!
#4 Good funds don't advertise.
#5 Avoid the usual past performance > riskiness of fund > manager's rep (some don't) > fund expenses > popularity of fund.  Look from the opposite direction and do your filtering from there.

Tuesday, October 14, 2014

Aboi's Updates For Malaysian Equities Mutual Funds for 2H'2014


Equities


TER is the total expense ratio, a measure of total cost (purchase, redemption, auditing, management fees) of a fund to the investor. The lower the better.

Commentary
[1] 4/5 of picks since 2012/2013 in four broad categories have since performed admirably: Kenanga Growth, Select Opportunity, Eastspring Small-cap and HL Consumer.
[2] I have added Affin Hwang Select Asia Quantum in which I will explain later over Eastspring's Small-cap fund as a better choice.
[3] The sole under performer is Public's Far East Property & Resorts (Property - indirect Asia fund) which has been performing flattish for almost two full years and thus under flagged. The fund is invested primarily in Asia emerging and developed markets e.g. Malaysia, South Korea, Indonesia. The performance is similar to PB Asia Real Estate Income fund (from Mixed Assets). Under flagged.
[4] As of this writing, I own Kenanga Growth Fund which has been performing above my expectation. Though it has recently changed fund manager in 2013, the fund is still up to par and I will be closely watching. 

[5] Even though Philip Master Equity Growth is top I shun it for the sole reason that the TER (total expense ratio) is a whopping 4%!.
[6] I also own Aberdeen Islamic World Equity Fund. This fund is only 1.5 years old and there is really no useful data to show. In due time I will share of course.
You may read why. 
Aberdeen Funds in Malaysia..Are They "Iron" Clad Investments?
Aboi To Finally Invest In Aberdeen Islamic World Equity Fund


Here's risk-adjusted returns measure using the five principles of risk measures; alpha, beta, r-squared, std deviation and Sharpe ratio. I will just explain what they represent rather than showing hefty equations.

Alpha: A +ve of 1.0 means the fund has outperform its benchmark index by 1.0%. The opposite goes for -ve.
Beta: A +ve of 1.2 means the fund is 20% more volatile than the index. The higher the beta suggest it offers the possibility of higher returns but also posing more risk. The opposite goes for -ve. 
R-squared: A higher R-squared will indicate a more useful beta value (85 to 100) aka good correlation. A low R-squared value means you should ignore the beta. It's a measure on well the fund is measured against an appropriate benchmark.
Standard deviationA large dispersion tells us how much the return on the fund is deviating from the expected normal returns.
Sharpe Ratio: The greater a portfolio's Sharpe ratio, the better its risk-adjusted performance has been. It describes how much excess return you get for extra volatility you endure in holding riskier asset.


Source: MorningStar - Rating & Risks section for respective fund
Immediately you will notice why I prefer Affin Hwang's Quantum over Eastspring Investments Small-cap. Sharpe ratios are similar but with Quantum's std dev at almost half of Small-cap's - less volatility. This explains why the Preservation rating of Small-cap is at an appalling 2. Nevertheless both are in different categories and they do excel at what they do. However I cannot stomach such volatility and would certainly lean towards Quantum. Perhaps you can :)


Second. There are three outstanding performers - those with Sharpe ratios of 2.26 & 2.27. With R-squared values around 80, I can take into consideration the Alpha and Beta values. MY Focus has the highest Beta, an indication of 30% more volatile than the market so I wouldn't stomach that either. That leaves Kenanga Growth and Equity Income. Equity income is the clear winner - lower Beta and less Std Dev. Would I consider it? Yes. But I already have Kenanga Growth which comes really close to it and I do not wish to increase my exposure purely into Malaysia equities.

So what's next? Definitely times are getting hard as equities start to peak especially in America and bonds floating as interest rates are as low as it can be. Europe looks like it's entering a recession as Germany recorded minus GDP growth for a second consecutive quarter and France still stagnating. I would say Asia (exc Japan). Funds that have such focus (SIF and Quantum) might still do okay but don't expect sky high returns. Unfortunately the world is in a more tangled position than it was in 2008. The best would be to hold more cash and wait to accumulate.
   
***************************************************************
My five rules of choosing funds:
#1 Avoid choosing big sized popular funds!
#2 Compare fund expenses!
#3 Information on the fund manager!
#4 Good funds don't advertise.
#5 Avoid the usual past performance > riskiness of fund > manager's rep (some don't) > fund expenses > popularity of fund.  Look from the opposite direction and do your filtering from there.

Wednesday, October 8, 2014

Aboi's Updates For Malaysian Mixed Assets Mutual Funds for 2H'2014

I continue the series of update with Mixed Assets. Yesterday I did the Bonds category. You may recap my first half update: Aboi's Updates For Malaysian Mutual Funds for 1H'2014It is called mixed asset because it has exposure on both the bond market/money market as well as equities (remind you again stocks). The exposure percentages differ based on fund prospectus (make sure you read them after screening the funds) so they can generally be divided into four:
  • Aggressive (e.g. 70% equities/30% fixed income)
  • Balanced (e.g. 50/50)
  • Conservative (e.g. 30% equities/70% fixed income)
  • Flexible (up to 100% in equities/fixed income)

Mixed Assets
TER is the total expense ratio, a measure of total cost (purchase, redemption, auditing, management fees) of a fund to the investor. The lower the better.

Commentary
[1] All my top three picks in the three main categories since Dec 2012 have excellent performance so far.
[2] The sole exception of 2nd choice UOB KidSave (Balanced fund) which has been performing flattish for almost two full years and thus under flagged. The fund is invested primarily in Asia emerging and developed markets e.g. Malaysia, South Korea, Indonesia. It had a good run between late 2008-early 2013 with the same manager now so I'll give it some time still.
[3] As of this writing, I own Affin Hwang Select Income Fund which has exposure in Asia ex Japan and has been performing to my expectation.

What about the recently 'hot' and 'spicy' Eastspring funds? 

Updated 09/10/2014:
My analysis and use of ratios has been wrong and I apologize. I will use a better risk-adjusted returns measure using the five principles of risk measures; alpha, beta, r-squared, std deviation and Sharpe ratio. I will just explain what they represent rather than showing hefty equations.

Alpha: A +ve of 1.0 means the fund has outperform its benchmark index by 1.0%. The opposite goes for -ve.
Beta: A +ve of 1.2 means the fund is 20% more volatile than the index. The higher the beta suggest it offers the possibility of higher returns but also posing more risk. The opposite goes for -ve. 
R-squared: A higher R-squared will indicate a more useful beta value (85 to 100) aka good correlation. A low R-squared value means you should ignore the beta. It's a measure on well the fund is measured against an appropriate benchmark.
Standard deviationA large dispersion tells us how much the return on the fund is deviating from the expected normal returns.
Sharpe Ratio: The greater a portfolio's Sharpe ratio, the better its risk-adjusted performance has been. It describes how much excess return you get for extra volatility you endure in holding riskier asset.


Source: MorningStar - Rating & Risks section for respective fund

It may seem to suggest that Eastspring's Dana Dinamik fund performance is not just through lucky pickings or mere coincidence. Definitely under the watch list. On the other hand under the Balanced category, Eastspring's Alpha Std Deviation value is 2% higher than that of its closest competitors. Though with a higher Sharpe ratio it's Std Dev is behaving more like a Flexible fund rather than a Balanced one. This is also confirmed when comparing it's Alpha & Beta to Dana Dinamik, very similar indeed. Too much volatility & risk taking which is expected when chasing higher returns in my opinion. For comparison sake I took another: CIMB Principal.

What could possibly explain Eastspring's rapid ascension in the rankings? Perhaps it was the establishment of a new independent brand name from Prudential and possibly an internal shakeup for all we know. All I know is that has been operating under 'Management Team' in early 2012 as per MorningStar report. Prudential announces new Asia asset management brand – Eastspring Investments. As usual I will poke fun at Public Bank. The RM9 billion fund (immensely huge) is starting to crack, falling from 4 to 13 in rankings.

My five rules of choosing funds:
#1 Avoid choosing big sized popular funds!
#2 Compare fund expenses!
#3 Information on the fund manager!
#4 Good funds don't advertise.
#5 Avoid the usual past performance > riskiness of fund > manager's rep (some don't) > fund expenses > popularity of fund.  Look from the opposite direction and do your filtering from there.

Monday, October 6, 2014

Aboi's Updates For Malaysian Bond Mutual Funds for 2H'2014

I will post about Mixed Assets and Equities in the coming days before Budget day. It is going to be similar to how I did last time: Aboi's Updates For Malaysian Mutual Funds for 1H'2014

Bonds
TER is the total expense ratio, a measure of total cost (purchase, redemption, auditing, management fees) of a fund to the investor. The lower the better.

Commentary
[1] Added Areca enhancedINCOME fund and as a third fund choice.
[2] Although my top four pickings perform neck-to-neck, AMB Dana and Areca will remain as bottom choices primarily because of higher expense ratio
[3] AmDynamic despite major redemption by investors is now back in black. ~3% returns (year-to-date) as of early October. Subscription has reopened and with new investors no more losses is expected.
[4] For outside exposure, both Affin Hwang Select Bond and HL Global Bond remains top choice. No competitors come even close to them.
[5] As of this writing, I own AmDynamic Bond Fund and the loss reversal is to my expectation.

You may be wondering why not AMB Income Trust and Areca enhancedINCOME. The reason is simple; a fund that leap frogs in ranking quickly may suggest that it is involved in high risk high return choices. It is of my opinion that a bond fund should be the least risky asset class (vs Mixed Assets & Equities type) and as such should strive for a balanced, consistent and sustainable returns. A good bond fund should give a higher return than that of a fixed deposit account at the expense of more risk.

Take a look at what I meant by 'extraordinary results' which by my experience is associated to more risk taking in search of higher returns. The question is, what if those high risk takes don't turn out well?
'Extraordinary' returns for a Bond fund in early 2013. Both these funds have very high Std Deviation values (7.68% and 7.44% respectively). AMB Income Trust is more favourable due to a far better Sharpe ratio of 1.35 than RHB-OSK's 0.60 preferred if you can digest its risk.
The more consistent performers under the Bond umbrella. (Std deviation values from left to right: 2.24%, 1.43%, 1.28% and 1.02% only) with Sharpe ratio of nearly 1 except AmDynamic at 0.47. (probably due to massive redemption and reopen of subscription recently)

Updated 09/10/2014:
My analysis and use of ratios has been wrong and I apologize. I will use a better risk-adjusted returns measure using the five principles of risk measures; alpha, beta, r-squared, std deviation and Sharpe ratio. I will just explain what they represent rather than showing hefty equations.

Alpha: A +ve of 1.0 means the fund has outperform its benchmark index by 1.0%. The opposite goes for -ve.
Beta: A +ve of 1.2 means the fund is 20% more volatile than the index. The higher the beta suggest it offers the possibility of higher returns but also posing more risk. The opposite goes for -ve. 
R-squared: A higher R-squared will indicate a more useful beta value (85 to 100) aka good correlation. A low R-squared value means you should ignore the beta. It's a measure on well the fund is measured against an appropriate benchmark.
Standard deviationA large dispersion tells us how much the return on the fund is deviating from the expected normal returns.
Sharpe Ratio: The greater a portfolio's Sharpe ratio, the better its risk-adjusted performance has been. It describes how much excess return you get for extra volatility you endure in holding riskier asset.

Source: MorningStar - Rating & Risks section for respective fund

Previously I take into account both Alpha and Sharpe values only. That was a mistake. With a poor correlation I have to ignore both Alpha and Beta values and put my focus purely on Std Dev. The highlighted values in my opinion are very high for a bond fund. They might have the volatility much like Mixed AssetsThough the Sharpe Ratio value for Income Trust looks solid it is difficult for me to swallow such deviation. Until these values go down to a more reasonable level I will shy away no matter how 'extraordinary' the returns are during good times.

Thursday, October 2, 2014

Aboi's Updates For October 2014

Side topic - Why It All Makes Sense. 
My comments to the following articles:
BN raises prices as real fuel cost drops – Rajiv Rishyakaran
No reason to raise petrol price when crude oil price is at a 3-year low – Chong Zhemin

The rise in fuel price looks to coincide right before the tabling of budget 2015. [First] Our revenues would have fallen from oil (Petronas) due to declining crude oil prices which is expected to go even lower when shale oil production kicks in from other big player countries, apart from The United States. [Second] Increasing the price now (aka remove subsidy) could potentially be part of the plan for the new fuel subsidy scheme where lower class people would enjoy cheaper fuel than it is at current new prices [Third] A higher base price (6% of RM2.30 is more than 6% of RM2.10) eventually leads to more taxation when 6% GST kicks in April 2015 thus giving the government more tax revenue to compensate for the loss of oil revenue from Petronas. We either start cycling around or simply earn more $$. This is why it all makes sense.

**You may read back my earlier post: No Suprise - Petrol Likely GSTed


KLSE TECH REVIEW

Here's the link for my last market sense: Aboi's Updates for September 2014
For those who find it hard to follow I suggest reading through my previous posting on how I am using technical indicators as a trend seeker.
  1. First Attempt on Tech Analysis Part 1
  2. First Attempt on Tech Analysis Part 2

Recap - September's commentary. 

"Ever since Bursa has been trading sideways. Indicators do suggest that the trend will be as such. Until after BNM's two MPC meeting and after Budget 2015 I will not change my end of year Bursa target of 2000 (assuming no major incident). Resistance and support lines are loosely created, I'm not interested as I believe it's gonna trade sideways until our Budget announcement." Bursa did breach my support 1 @ 1860 and thus I've moved it to 1840. I shall define trading sideways as in +2% to -2% of total index points to make it really measurable. The most forthcoming event would be the tabling of Budget 2015 on October 10th. Until then we wouldn't know the winners and losers of the economic sectors so expect it to trade sideways in the next 10 days.

Key economic news and market update from AMP Capital's economic update (FoC, updated every Friday):
1. Geopolitical threats are rising like the Islamic State. 
2. Hong Kong's street protests on universal suffrage. Slight regional impact on shares.
3. Eurozone's and Japan's PMI for September is disappointing leaving recovery being described as losing momentum. More quantitative easing is needed.
4. Reserve Bank of Australia expressed concern that housing market is becoming too speculative but only to extend macro-prudential controls and not raise interest rates until 2015.


Portfolio - Marginal gains, Funds performing
Because much of the weight of the portfolio is invested in Bursa, it has been following the pattern of KLSE - sideways that is. Nevertheless my bonds fund have yielded more positive results and backed by better returns from Aberdeen World fund. I've taken a look into how to adjust my portfolio position. You may read about it in my previous post The Balancing Act.


PORTFOLIO REVIEW
Portfolio target composition. Equities 65%, Bonds 25% and Supplementary 10%.
Targets for returns p.a. Equities 12%, Bonds 5% and Supplementary 3.5%.

Notes
**HwangDBS Select Income fund gross income declaration of RM0.005/unit (reinvested all into 83 new units)

Comments
#1 Portfolio target for the fourth portfolio year @ RM140k for April 2014 has already EXCEEDEDPortfolio target for the fifth portfolio year @ RM152k for April 2015. The TWRR (time weighted annual return rate is now at 9.50% (down 0.08% from Sept'14vs my target of 9.40%).


What's up for my 2014?
***Please NOTE that KEEP IN VIEW is not the final decision***
[1] Invest roughly 25% of cash balance in Aberdeen's Islamic World Equity Fund. 
        -> Completed. No more new positions.
[2] Par my remaining cash balance to less or equal to 10% level. 
        -> Completed. See portfolio.
[3] Invest in a new mREIT: Time To Revisit mREITS in 2014 when yields are right. 
        -> Ongoing. Second article to be published with more details.
[4] Invest another fund, diversify further into small cap-medium cap companies where I have no exposure. 
        -> Cancelled. Heavy weighted in Malaysia.
[5] Possible buy of gold commodity: Speaking Of Recent Gold Demand Trends. My opinion is that gold will see resistance at $1340. 
        -> Keep in view. Central banks purchases is supporting gold prices making it difficult for me.
[6] Taking a look (not necessarily invest) in Padini holdings. 
        -> Ongoing.
[7] Put some cash into Fixed Deposit. 
        -> Completed. Very small amount. It will be used every 2 years :)


Disclaimer: The reports, analysis and recommendations in this blog are solely my personal views. I do not link to any investment body or company. As such, I will not be responsible of any of your investment decision. Consult your investment adviser or come to your own conclusions before making any investment decision.