
Moving Average Convergence-Divergence (MACD)
MACD turns two trend-following indicators, moving averages, into a momentum oscillator by subtracting the longer moving average from the shorter moving average. Thus MACD offers the best of both worlds: trend following and momentum. Traders often look for signal line crossovers, centerline crossovers and divergences to generate signals.
To cut technicalities short, MACD is all about the convergence and divergence of the two moving averages. One called shorter moving average (12-day) is faster and responsible for most MACD movement. The longer moving average (26-day) is slower and less reactive to price changes in the underlying security.
- Positive MACD indicates that the 12-day EMA is above the 26-day EMA. Positive values increase as the shorter EMA diverges further from the longer EMA. This means upside momentum is increasing.
- Negative MACD indicates that the 12-day EMA is below the 26-day EMA. Negative values increase as the shorter EMA diverges further below the longer EMA. This means downside momentum is increasing.
Signal Line Crossovers
A bullish crossover occurs when MACD turns up and crosses above the signal line. A bearish crossover occurs when MACD turns down and crosses below the signal line. Look at the KLCI chart below, 11 crossovers in a just a span of 6 months!
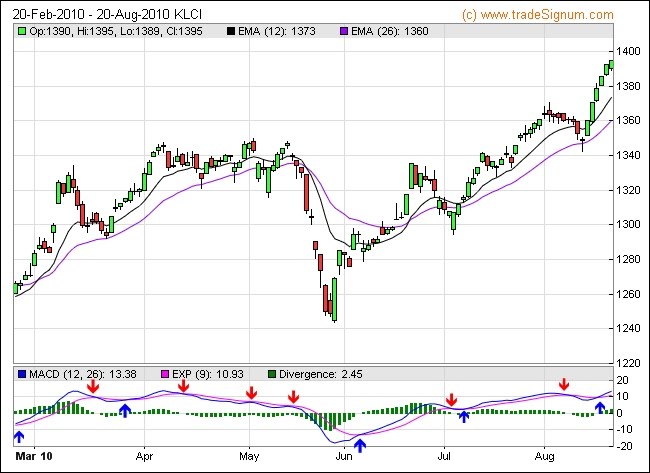 |
| Chart Setting: EMA 12, EMA 26, MACD (26, 12, 9), Feb'10 to Aug'10 |
Our stock market is very volatile (many ups and downs). Because signal crossovers are common it is difficult to use this indicator as a long term indicator for a trend because you can see so many mixed signals. It takes a strong move in the underlying security to push momentum to an extreme just like what it happened at end of May. Note that MACD surged below to nearly 20. To me this chart is just a FYI, not useful unless you play the risky short-term game. So how? Read on..
A bullish centerline crossover occurs when MACD moves above the zero line to turn positive. This happens when the 12-day EMA of the underlying security moves above the 26-day EMA. A bearish centerline crossover occurs when MACD moves below the zero line to turn negative. This happens when the 12-day EMA moves below the 26-day EMA.
 |
| Chart Setting: EMA 12, EMA 26, MACD (26, 12, 9), Feb'10 to Aug'10 |
Looking at the centerline crossovers minimizes volatility and able to show us a better picture of bullish and bearish activity (correction). Centerline crossovers does not work well when there is high volatility such as in the case when a stock moves up and down quickly like a zig zag within days or one-two weeks. In my opinion it works really well on KLCI index. Our bears and bulls run for a long duration and our correction are usually a month or so period.
Can be seen clearly that KLCI is now performing far away from the centerline. A crossover is not imminent. But it does show that it is at its peak. Just like RSI, this indicator tells us that investors are still bullish, no signs of bearish activity. Speculation driving momentum do you think so? I can tell you fundamentally a lot of stocks, well most of them are either fairly valued or overvalued.
Can be seen clearly that KLCI is now performing far away from the centerline. A crossover is not imminent. But it does show that it is at its peak. Just like RSI, this indicator tells us that investors are still bullish, no signs of bearish activity. Speculation driving momentum do you think so? I can tell you fundamentally a lot of stocks, well most of them are either fairly valued or overvalued.
Stochastic Oscillator "doesn't follow price, it doesn't follow volume or anything like that. It follows the speed or the momentum of price. As a rule, the momentum changes direction before price." As such, the Stochastic Oscillator can be used to identify bullish and bearish divergences to foreshadow reversals. This oscillator can also identify bull and bear set-ups to anticipate a future reversal. If you mind, you can go ahead and read about it but Stochastic to me is too volatile. I prefer to keep investing simple and avoid indicators that show a lot of mixed and false signals.
 |
| Chart Setting: SMA 1, Slow Stochastic (14, 3), Aug'09 to Aug'10 |
Support and Resistance
One key skill is to know how to identify support and resistance levels. They represent key junctures where the forces of supply and demand meet. In the financial markets, prices are driven by excessive supply (down) and demand (up). As demand increases, prices advance and as supply increases, prices decline. When supply and demand are equal, prices move sideways as bulls and bears slug it out for control.
Support Level
Technically support is the price level at which demand is thought to be strong enough to prevent the price from declining further. There is always a new support level once the current one is broken. Support breaks and new lows signal that sellers have reduced their expectations (to a new support level lower) and are willing sell at even lower prices.
Resistance Level
Resistance is the price level at which selling is thought to be strong enough to prevent the price from rising further. Once resistance is broken, another resistance level will have to be established at a higher level. Resistance breaks and new highs indicate buyers have increased their expectations and are willing to buy at even higher prices.
The red circle is to show that old resistance has become the new support. The breakout above resistance proves that the forces of demand have overwhelmed the forces of supply. This is why I chose it as the current support line. Resistance is just a guess by buffering 10 points. I think that's a pretty good estimate :)
The truth is there is no exact science to tell where the support and resistance level is but being aware of their existence and location can greatly enhance one's analysis and forecasting abilities. A resistance breakout signals that demand (bulls) has gained the upper hand and a support break signals that supply (bears) has won the battle. You can go and browse mags and I guarantee there will be different support and resistance levels given by various analysts. Just like Warren says, I rather be approximately right than be precisely wrong.
One key skill is to know how to identify support and resistance levels. They represent key junctures where the forces of supply and demand meet. In the financial markets, prices are driven by excessive supply (down) and demand (up). As demand increases, prices advance and as supply increases, prices decline. When supply and demand are equal, prices move sideways as bulls and bears slug it out for control.
Support Level
Technically support is the price level at which demand is thought to be strong enough to prevent the price from declining further. There is always a new support level once the current one is broken. Support breaks and new lows signal that sellers have reduced their expectations (to a new support level lower) and are willing sell at even lower prices.
Resistance Level
Resistance is the price level at which selling is thought to be strong enough to prevent the price from rising further. Once resistance is broken, another resistance level will have to be established at a higher level. Resistance breaks and new highs indicate buyers have increased their expectations and are willing to buy at even higher prices.
 |
| Chart Setting: Feb'10 to Aug'10 (6 months) |
The red circle is to show that old resistance has become the new support. The breakout above resistance proves that the forces of demand have overwhelmed the forces of supply. This is why I chose it as the current support line. Resistance is just a guess by buffering 10 points. I think that's a pretty good estimate :)
The truth is there is no exact science to tell where the support and resistance level is but being aware of their existence and location can greatly enhance one's analysis and forecasting abilities. A resistance breakout signals that demand (bulls) has gained the upper hand and a support break signals that supply (bears) has won the battle. You can go and browse mags and I guarantee there will be different support and resistance levels given by various analysts. Just like Warren says, I rather be approximately right than be precisely wrong.
No comments:
Post a Comment