Top Post Views

3: Malaysia REITs - Looking For My 2nd Durian Runtuh
4: Is Insurance Really Necessary?
5: Everyone Must be A Millionaire

Head to the watch list on the above tab to see my what's on my radar and foreseeable future postings =)

Decided to make adjustments on the way I blog & share due to time constraints and other commitments. In the coming weeks you should see them. Short updates but more frequent & concise.

Wednesday, January 30, 2013

MPHB: Applying Volume Spread Analysis Method (VSA)

Multi-Purpose Holdings Berhad is engaged in investment holding, provision of share registration and management services. The Company operates in four segments: financial services, which is engaged in the provision of credit and related services and underwriting of all classes of general insurance business; securities broking and dealing, which is engaged in the provision of stockbroking services; property investment and leisure, which is engaged in the ownership of buildings for rental income and hotel operation, and gaming (Magnum). Its other business segments include investment holding, property development and dormant companies.
This simple experiment was based on a reading from the book Master The Markets by Tom Williams (I believed he is 77 now) written back in 2005 and you couldn't find it in a bookstore nor in Amazon (http://www.goodreads.com/book/show/8238770-master-the-markets). A thing to note before we go into technical. Market professionals are traders involved in the market purely for the purpose of making a profit. They will first plan and launch a campaign to acquire a particular stock. So now I'll begin explaining the diagram above:

VSA Buying Climax - signs of weakness
The ultra high volume plays a key role. It means that market pros are selling to unsuspected retail investors like us because most of the individuals traders whose judgment will be clouded by all the great news floating around them. All these traders rush into the market buying it while the pros are offloading them hence the ultra high volume. Once this transfer has taken place a bear market is guaranteed.

VSA Up-Thrust - signs of weakness
Indicated by a wide spread during the day but falls to close on the low, on high volume. This is the logic, if the high volume seen was buying, then the closing price would have been on the high and not on the low. Hence the close on low suggests there is more selling than buying in the high volume within the marketplace. We get a bear run again.

VSA Shakeout - signs of strength
This is intended to remove many investors and traders from the market, obviously all those un-pros. News will be bad and this is used by the pros to panic people out of their positions. Usually after a shakeout the market will move sideways with low volume because the pros would try to buy as much of the stock as they can, without significantly putting the price up against their own buying. This stage is called the accumulation phase; some last for a few days, I have seen some for weeks.

VSA Testing - signs of strength
Prices are marked down rapidly during the day but the price would recover to close near the high of the day with low volume. This signals that the market has been marked down and has attracted no professional selling due to the low volume. Remember that the pros hold the volume, so when they do not sell, the market has little choice but to go up as it is driven by the usual supply and demand.

Having said that Aboi's recommendation is (remember this is an EXPERIMENT on a new method before I decide to adopt it). *Target price is based on average target price set by Research houses (btw I have lots of faith towards Kenanga's research). (http://klse.i3investor.com/servlets/ptg/3859.jsp)

Target price: RM4.18 TRADING BUY
Fundamentals: Short Term OutPerform (1-year period)
Technical/VSA: Short Term Bullish (3-month period)
Risk Level: High

Disclaimer: The reports, analysis and recommendations in this article are solely my personal views. I do not link to any investment body or company. As such, I will not be responsible of any of your investment decision. Consult your investment adviser or come to your own conclusions before making any investment decision.

Saturday, January 26, 2013

EPF Member's Investment Scheme. WHAT, WHY, HOW..SURE OR NOT? (Part 4)


This is the fourth installment for the series. If you miss the first three, here's the link:
EPF Member's Investment Scheme. WHAT, WHY, HOW..SURE OR NOT? (Part 1 - Intro)
EPF Member's Investment Scheme. WHAT, WHY, HOW..SURE OR NOT? (Part 2 - Bonds)
EPF Member's Investment Scheme. WHAT, WHY, HOW..SURE OR NOT? (Part 3 - Equities)
For the last installment (will be posted in the next two days) I will show how easy it is to monitor your investments (just a cup of coffee and a good Saturday afternoon!) and my conclusions.


The Mixed Asset Class (The Best of Both Worlds)


It is called mixed asset because it has exposure on both the bond market/money market as well as equities (remind you again stocks). The exposure percentages differ based on fund prospectus (make sure you read them after screening the funds) so they can generally be divided into four:
  • Aggressive (e.g. 70% equities/30% fixed income)
  • Balanced (e.g. 50/50)
  • Conservative (e.g. 30% equities/70% fixed income)
  • Flexible (up to 100% in equities/fixed income)

Step 1: Expectations. Decide your risk profile. I will pick 8% returns p.a. and thus the following will be used for screening: 1-year returns 8%, 3-year returns 26% and 5-year returns 47%.

Step 2: Screening. Fund screening can be done via web @ lipperleaders.com.

Step 3: Weeding. That was a snap by simply using the 5-year returns criteria. Only the top 4 funds remain. As usual there are exceptions when you are looking for insurance linked funds. Also RHB’s GoldenLife funds aren’t bad either if you are looking at the “Target Maturity Other” category.

*Expected returns: 1-year returns 8%, 3-year returns 26% and 5-year returns 47%.

Step 4: Fund Size. Hwang Select Income is huge in comparison. Some of you may know that I have invested some decent amount of money into this fund for the past 2 years but back then it was only RM400 million in size =) so it has become too popular. You can either switch it. But if you are looking for something Conservative this is still the only good choice available.


Step 5:  Preservation. All four looks good. No changes required.

Step 6: Expenses. They look more or less the same except that MAAKL offers 2 free switches each year. Like in equities, we have different classifications, so you can opt to diversify in all of them but I'll say just pick one =) as most of them have exposure in Malaysia only. You can flip a coin and decide whether to go with Hwang Select Balanced or OSK-UOB Kidsave Trust.

MAAKL-HW Flexi stands out as it is investing 100% into equities during times of boom/bullish period and switch to money market strategy when market is in bearish mode.
Go with MAAKL-HW Flexi (flexible type) with a track record of *17.70% returns p.a.!!
Go with Hwang Select Balanced (balanced type) with a track record of *10.90% returns p.a.!! OR
Go with OSK-UOB Kidsave Trust (balanced type) with a track record of *9.50% returns p.a.!!
Go with Hwang Select Income (conservative type) with a track record of *8.70% returns p.a.!!
*Minus annual management fee not considering one time sales charge, returns p.a. based on 5 year performance.

Disclaimer: The reports, analysis and recommendations in this article are solely my personal views. I do not link to any investment body or company. As such, I will not be responsible of any of your investment decision. Consult your investment adviser or come to your own conclusions before making any investment decision.

Sunday, January 20, 2013

EPF Member's Investment Scheme. WHAT, WHY, HOW..SURE OR NOT? (Part 3)

This is the third installment for the series. If you miss the first two, here's the link:
EPF Member's Investment Scheme. WHAT, WHY, HOW..SURE OR NOT? (Part 1 - Intro)
EPF Member's Investment Scheme. WHAT, WHY, HOW..SURE OR NOT? (Part 2 - Bonds) 


The Equities Class (Highest Risk/Best Returns)

Equities are also known as stock. This is where shares like GENTING, PBBANK, PROTON and the others are listed and traded every day. Things get more interesting in this class because #1 Highest amount of funds in this class #2 Highest amount of “ka-ching” on board and #3 Spoilt by choice with mind boggling categories. However the truth is, there are only several categories that are worth to invest as highlighted by green rows in the below diagram which shows you the total returns % up the last five. 

Legend: *Red: negative returns. *Blue: weak single digit returns *Green: double digit returns
Source: Summarized from The Edge Magazine Lipper Fund table dated on the 2nd week of December

Step 1: Expectations. Decide your risk profile. I will pick 10% returns p.a. hence the following will be used for screening: 1-year returns 10%, 3-year returns 33% and 5-year returns 61%.

Step 2: Screening. Fund screening can be done via web @ lipperleaders.com. If you observe carefully I also added two additional funds which do not have a Lipper Rating of 5. This is because for their classification there are not enough funds to classify them. You ought to eyeball the hardcopy table from The Edge magazine or Personal Money to find them and add in the list for analysis. They are Hong Leong Consumer and Hwang Asia Quantum.

Step 3: Weeding. Half the list is gone by simply using the 5-year returns criteria. Some exceptions:
  1. Seek exposure on Equity Malaysia Sm&Mid Cap, choose Public Focus Select half the size of Public Small Cap and has better preservation record so you don’t get a heart attack.
  2. Seek exposure on Asia Pacific REIT’s go with the only choice of MAAKL Asia Pacific fund. *By REIT class standards 8.4% returns p.a. is considered handsomely rewarding =)
  3. Insurance investment-linked plans you can go with AIA, Allianz and Etiqa choices below.
*Expected returns: 1-year returns 10%, 3-year returns 33% and 5-year returns 61% (this alone killed half the list).

Step 4: Fund Size. Usually bigger funds do not outperform smaller ones but anything less than RM 1 billion for an equity fund is fine so we have nothing to wipe out from the list. Need prove? The table below shows the biggest elephant size equity funds in Malaysia. Not that I am against Public but the underlying problem facing them is that they are too popular, this is why they are big. Imagine that you have RM1 billion to manage, you CANNOT simply dump them into 30 different stocks as they will be too overvalued. So the only logical choice you have is to spread it out vastly on over 300 companies in the main board which make it look like a stock market itself - and probably end up spreading the fund manager's attention too thin.
Source: Summarized from The Edge Magazine Lipper Fund table dated on the 2nd week of December
REMEMBER THIS: Never ever will any bigger fund outperform a smaller fund. But not all smaller funds can do better than bigger funds. Confused haha?


Step 5:  Preservation. There’s one that really stands out, we’ll remove Philip Master Equity. Second point: by looking at the 3 Year returns only three funds made it above 80% as well as providing >20% returns for a year period as well. Third point: All three are in different classifications so that’s a good point for diversification as you don’t want to put all your eggs into a punitive country like Malaysia that looks like a dot on the world map.
So I shall short the list. Now you clearly see that these funds are not BIG in size and they perform superbly well with consistent results among each other.

Step 6: Expenses, expenses and expenses. Select those three funds for comparison at the web link: http://www.invest.com.my:8080/personal/funds/compare/ and the here comes the magic. They are roughly the same and because all three are in different classifications, just diversify in all of them =)
Go with HL Consumer Products with a track record of *17.38% returns p.a.!!
Go with Hwang Asia Quantum with a track record of *18.50% returns p.a.!!
Go with Kenanga Growth with a track record of *15.10% returns p.a.!!
*Minus annual management fee not considering one time sales charge, returns p.a. based on 5 year performance.


Remember from my previous post in Part 1"At 15% returns p.a., RM5, 000 will grow to RM330, 000 in 30 years! But with 5% (EPF) p.a. you will only obtain RM21, 600. Stretch it to 10% it grows to RM87, 000! Let’s don’t argue at this page whether 15%-10% is achievable or reasonable, I will leave it for future postings." 

Here I rest my case AGAIN!!, all the above have better than 15% p.a. average returns. Next part I will dwell into the Mixed Assets class (a mix of Bonds and Equities for the not so brave)


Disclaimer: The reports, analysis and recommendations in this article are solely my personal views. I do not link to any investment body or company. As such, I will not be responsible of any of your investment decision. Consult your investment adviser or come to your own conclusions before making any investment decision.

Sunday, January 13, 2013

US Stock: Intel Corporation Jan 2013

Company Profile
Intel is still the biggest semiconductor company in the world. Intel has its Atom microprocessor for smart phones. There is a growing trend of mobile phones with internet access such as the iPhone, Android and BlackBerry. Intel plans to use its atom microprocessors to try to enter the mobile phone market industry. How has that been going? Let's take a look at the revenue breakdown from the Annual Report of 2011. 

  • PC Client (desktop + laptop markets): $35.4/$54 =  65.55%
  • Data Center (servers): $10.1/$54 = 18.70%, 
  • Software (e.g. McAfee) = 3.46%. 
  • This effectively means only ~12% is attributable to Intel Mobile Communications (IMC), the Intelligent Systems Group (ISG), the Netbook and Tablet Group (NTG), and the Ultra-Mobility Group (UMG). 
With PC sales being stagnant and losing ground (see graph and purple regions) to smartphones + tablets after 2011, market environment is tough for Intel to sustain revenue growth unless they start entering this new market more SERIOUSLY. This remains the biggest risk and turning point for Intel: Whether they can be relevant in the smartphones + tablet market.
Source: 2012 KPCB Internet Trends
Financial Charts
#1 Profit Margin (red line) for Intel is pretty decent on an average of 20%. I take into account cost for R&D as well as marketing to get the final tally of profit margin because they are still essential COST in order to run the business. Intel is smart at boasting about gross margin which is always above 55% for the last three years but what matters to me is profit margin.
#2 ROA (green line) and ROCE (aqua line) looks fine. As long as they correlate with each other, Intel is using its available resources wisely.
#3 The jump in revenue growth rate (orange line) for 2010 is nothing special, first due to the recovery in demand from the global crisis and second because Intel has now monopolized the PC processor market thanks to AMD not wanting to compete head to head anymore. By looking at revenue figures of 2011 together with the upcoming 2012 expecting a revenue of $53.8 billion, market has saturated. Thus I am not expecting any MIRACLES to see a big jump in growth rates anymore.


#1 EPS is growing healthily though this again is highly dependent on Intel making more and more money. The other more sneaky way of improving this ratio without having to generate more profits is by exercising share buy backs, this is what Intel has been doing for the year 2012. Though share buy backs is a positive move as long as the company has a healthy cash reserve it is nevertheless not a better option compared to increasing revenue. Hence take it with a pinch of salt.
#2 DPS has been on the increasing trend. The payout is still affordable to Intel and the payout ratio is not alarming. Btw as a semiconductor company, Intel's attractive dividend yield of 4% is one of the best in the tech industry. Impressive move by Intel to attract or keep investors like institutional funds happy.

Discounted Cash Flow Analysis
Projected Revenue Growth Rate: 4%/each year for the next 5 years til 2017

Operating Costs: 80% (includes cost of goods, R&D and marketing)
Corporate Tax: 24% (based on annual report 2011)
Capital Expenditures: $5.5 billion +4%/year 
Depreciation: $4.5 billion +4%/year
Working Capital Cost: same as projected revenue growth rate
Discounted Rate: 15%

Intel's fair value is priced roughly at $20.24. Push the revenue growth rate to 5% and you can value it at $21.01. The current stock price of $22.00 makes Intel within the fairly valued zone. Aboi still holds Intel being valued at most $25.00 (unchanged since my first analysis back in year 2010).

This is how my custom made DCF model input table looks like (Part 1)
This is how my custom made DCF model input table looks like (Part 2). Fair value computed below.
Technical Analysis
Using VSA (volume spread analysis) technique, you can google it, I would say Intel is in an accumulation stage now where the price would hold roughly within the fair value. The accumulation stage is where market professionals would try to buy as much shares as they can, without SIGNIFICANTLY putting the price up against their own buying. I believe this would happen until the Q2'13 results are out (which is usually Intel's strongest quarter). The key indicator of this would be ultra-high volume leading to the mark-up stage. We will take a look again in a few more months. Btw I sold most of my holdings at $26-$27 region halfway during the distribution stage last year, so for now Aboi says:

Target price: USD21.01 HOLD
Fundamentals: Short Term Market Perform (1-year period)
Technical: Medium Term Bullish (6-month period)
Risk Level: High

Disclaimer: The reports, analysis and recommendations in this blog are solely my personal views. I do not link to any investment body or company. As such, I will not be responsible of any of your investment decision. Consult your investment adviser or come to your own conclusions before making any investment decision.

Friday, January 11, 2013

EPF Member's Investment Scheme. WHAT, WHY, HOW..SURE OR NOT? (Part 2)


This is the second installment for the series. If you miss the first, here's the link: EPF Member's Investment Scheme. WHAT, WHY, HOW..SURE OR NOT? (Part 1) 

A start point would be to refer to Lipper ratings (a fund rating agency). You will need to get a hardcopy of the entire unit trust funds in Malaysia in a table from “The Edge” magazine RM5 and Personal Money RM8. You will also need to use this web link: http://www.lipperleaders.com/. The web offers the advantage of having to filter by asset type while hardcopy shows you the fund size (which is important as will be explained later) & Personal Money includes trust funds by insurance companies. In a nutshell one can narrow funds into the following major groups:

    #1 Equities (highest risk/best returns)
    #2 Mixed Assets (best of both)
    #3 Bond (lowest risk/least returns)

Using Lipper makes it easy because its ratings per classification are compared relative to peers of the same classification and are based on equal-weighted average of percentile rank. The highest 20% of funds in each classification receive a score of 5 a.k.a LEADER, the next 20% receive a score of 4 and so on until 1 (lowest 20%). Lipper uses those ratings on the three following conditions:

    1. Total Return; fund’s historical return performance.
    2. Return; fund’s historical risk-adjusted and adjusted for volatility returns.
    3. Capital Preservation; fund’s historical loss avoidance.

You will use this to define your “best unit trusts fund” criteria including another two additions: Fund Size and Expense. This will be explained as your read on la. First step is to define your expected or minimum returns. For example, I have an expectation of 12% per annum growth (greedy lo) and you will use that % for comparison against different years of total returns. You don’t have to take out your calculator and punch some numbers because I’ve wasted some of my lifespan doing it for you.
Certainly the % will differ based on asset type, I would say the following is a good guideline for everyone to begin screening for good funds:-
    #1 Equities =>10%
    #2 Mixed Assets =>6% to 9%
    #3 Bond => 4.5% (must be HIGHER than fixed deposit interest rates)

The Bond Asset (Lowest Risk/Least Returns)
Let’s start with bond which is a type of security where the issuer (debtor) owes the holders (creditor) and the coupon is the interest. Bonds can be issued in the financial market by various parties such as public institutions, companies, the government as well as credit institutions like banks. In the Malaysian market structure they are classified by the type of issuer-government, quasi-government and corporate. http://asianbondsonline.adb.org/malaysia/structure/instruments/bond_types.php

Step 1: Expectations. Decide your risk profile. I will pick 5% returns p.a. and using the table from the above, the expectations are: 1-year returns 5%, 3-year returns 16% and 5-year returns 28%.

Step 2: Screening. Fund screening can be done via web @ lipperleaders.com. Set a time period of “5 Year” with Total Return of “5 – Lipper Leader” and leave the rest by default. See an example below:-

Step 3: Weeding. Some hands on here; cross reference your results with The Edge/Personal Money. #1 Add fund size #2 Add 1-year and 3-years returns respectively. Using values from step 1 begin to cross out underperforming funds. Say “adios” to KAF Bond, RHB Islamic Bond & PB Fixed Income.
*Expected returns: 1-year returns 5%, 3-year returns 16% and 5-year returns 28%.

Step 4: Fund Size comes into the picture here. Usually bigger funds do not outperform smaller great ones hence I will weed those largest out. Now let’s shift+delete Public Islamic Bond and Public Bond.

Step 5:  Preservation as the next level differentiator so take off those with value of 2. That leaves only AmDynamic Bond and PB Islamic Bond. From here onwards your choices are narrowed down:

  1. Have an insurance investment linked plan? For Affin go for AXA Affin Active Bond.
  2. Likewise for Great Eastern; either Dana Sejati or Lion Fixed Income.
  3. Need bond market exposure out of Malaysia? Hwang Select Bond offers you that.

Step 6: Expenses matters!! Head to http://www.invest.com.my:8080/personal/funds/compare/, browse the menu and look for your fund OR you can compare up to 3 funds at once. Make an educated rough guess to see which is more expensive, you don’t need a PhD.


PB Islamic Bond: 15% fee of returns, O.M.G

Go with AmDynamic Bond with a track record of *9.40% returns p.a.!!

*Minus annual management fee not considering one time sales charge, returns p.a. based on 5-year performance

Remember from my previous post in Part 1"At 15% returns p.a., RM5, 000 will grow to RM330, 000 in 30 years! But with 5% (EPF) p.a. you will only obtain RM21, 600. Stretch it to 10% it grows to RM87, 000! Let’s don’t argue at this page whether 15%-10% is achievable or reasonable, I will leave it for future postings." 

Here I rest my case, a 9.40% p.a. average return is nearly 10% and here I am talking about only the Bond class which has the least risk. The best part has yet to come (Equities and Mixed Assets class), stay tuned!


Disclaimer: The reports, analysis and recommendations in this blog are solely my personal views. I do not link to any investment body or company. As such, I will not be responsible of any of your investment decision. Consult your investment adviser or come to your own conclusions before making any investment decision.

Thursday, January 3, 2013

EPF Member's Investment Scheme. WHAT, WHY, HOW..SURE OR NOT? (Part 1)


It is true that over the last decades since inception, EPF has done a decently good job at managing our savings fund. EPF declares an annual dividend on funds collected which hit a record high when Malaysia was an established manufacturing base and has since been progressively declining since 1996 and will continue to do so. The reason is simple; the lowered dividend rates are a result of EPF’s decision to invest in low-risk held to maturity investments, plainly speaking Malaysian Government Securities, loans, bonds and other money market instruments.
EPF’s exposure in held to maturity investments is now at a staggering 60% and is expected to gradually increase due to growing national debt, yes GROWING. The underlying problem with this strategy is that it is tightly knit with the interest market rate and for the past few years it has been low and will continue to do so owing to the slow recovery global economy. Expect an average of 5%.
Source: KWSP's annual reports
In April 2012, it announced that it will increase its investment in global equity and fixed income as part of its diversification strategy which is in line with the mandate given by the government for the EPF to invest up to 23% of its investment assets in international markets (currently at 14%). This pressure came about as the fund is growing at a large pace of nearly RM4 billion a month. It faces constraints domestically given the limited breath of investment products and liquidity to trade on large volumes. Hence it is moving to increase its investment overseas to complement EPF’s long-term investment plan and to provide a “reasonable rate” of return to the savings of its members.
Source: KWSP Annual Report for Financial Year 2011
In a separate report it is said that the fund’s global portfolio will be 20% by 2014. But remember, by going overseas, the fund will not be given the same preferential treatment as it has locally. It may very well be suckered into making deals. Domestically it was easy for EPF to take over our “daylight robber” PLUS highway with the backing of the government. Looking offshore, Khazanah paid a ridiculously high premium for healthcare assets in Singapore just because we have to cross a bridge just to get here oh??. So how confident can we be in making better returns overseas?
 It is a cause for concern when there the risks involved are tabled out, it has become greater. One, investing overseas is not really our forte; local funds with overseas exposure are under performing with some even deeper than the Pacific Ocean!! If the private sector is finding difficult it what should we expect of our public institution? Second, we have been running budget spending deficits (e.g.  Your bills are higher than your income) for the last 14 years until we’ve accumulated a total debt to GDP ratio of almost 55%. For a government that continues to overspend and shows no sign of abating, can you entrust your lifelong savings to continue crediting a gambler?
Nevertheless, EPF’s move is inevitable as it is becoming too large for the domestic market. EPF owns roughly 10-15% of the equity stock market and has crowded out other players, driven up valuations and reduced our already illiquid market. "And during his speech at Invest Malaysia 2010, Prime Minister Datuk Seri Najib Razak had said the EPF accounted for up to 50% of the local equity market's daily trading volume, which is NOT healthy. From an efficient market perspective, the stock market must be liquid enough such that no one single player can control the market," he added.
Source: Securities Commission Malaysia and KWSP annual reports
Looking overseas is positive for both the local economy and state investment funds. By extrapolating the growth of EPF and Bursa Malaysia, EPF will reduce its domestic equity stake to less than 10% by the year 2020 (assuming 35% in equities with 23% of it being global). With Bursa having a larger capital base but almost similar growth rate to that of EPF, more market capitalization will be available primarily to institutional funds like unit trust funds and secondly to retail investors (people like aboi who buys and sells as he pleases).
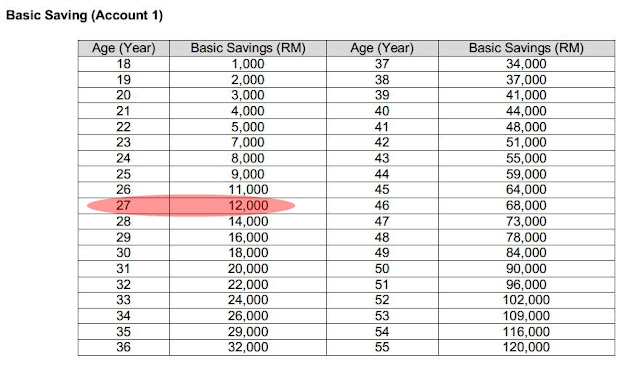
Investing your EPF monies in unit trust products gives you the opportunity to optimize the potential of your EPF savings for potentially higher returns (at acceptable level of risks) over the long-term, thus providing you with a potentially bigger pool of funds upon retirement. The scheme allows EPF members to invest 20% of the amount in excess of the required Basic Savings in Account I.
You can only invest through appointed unit trust management companies by the Ministry of Finance. You can find it via http://www.kwsp.gov.my/portal/en/web/kwsp/member/members-savings-investment-withdrawal. You are allowed to make your second withdrawal three months after your first withdrawal, provided you are still eligible. Why invest via this scheme?

1. No cash investment required - Investment is transacted directly from your EPF Account 1.
2. Diversification - Opportunity to diversify your retirement funds with EPF approved funds.
3. Capital appreciation - Opportunity to reap capital growth as part of the return on your investment to boost the total lump sum of your EPF savings.

And lastly to  maximize the power of compounding - If you are ignorant and you continue to hold your money in EPF which gives you an average of 5% return, how much will it grow? Your money will only grow 2x times (double) in 14 years. But what if you can maximize it to say 10%, your money will double in 7.5 years. 15% it grows 4 times every 10 years. If you eat enough ginseng and bird’s nest, you will probably have a lot of 10 years in your life! If you are 25 and you live until 75, you have five 10 years. Eat more ginseng and maybe you have six, seven or eight 10 years more.
The table above shows the Basic Savings amount required to be retained in Account 1 based on age. For example: A member at aged 27 with savings of RM40, 000 in Account 1. The required amount needed is at least RM12, 000. Hence the amount in excess of Basic Savings in Account 1 is as computed: RM28, 000 (RM40, 000 – RM12, 000). Eligible amount for investment scheme (20% x RM28, 000) = *RM5, 600. *Please note that the minimum investment amount for most unit trust funds is RM1, 000.

At 15% returns p.a., RM5, 000 will grow to RM330, 000 in 30 years! But with 5% (EPF) p.a. you will only obtain RM21, 600. Stretch it to 10% it grows to RM87, 000! Let’s don’t argue at this page whether 15%-10% is achievable or reasonable, I will leave it for future postings.

Click here for the link to Part 2 of this series.

Tuesday, January 1, 2013

Aboi's Updates for Jan 2013


Here's the link for the previous month's market sense: Aboi's Updates for Dec 2012
For those who find it hard to follow I suggest reading through my previous posting on how I am using technical indicators as a trend seeker.
  1. First Attempt on Tech Analysis Part 1
  2. First Attempt on Tech Analysis Part 2
KLSE ended the year with a bang, hitting an all time high of 1688. Following previous month, crossover and reversal trend happened and broke the resistance of 1645 as evident from the two EMAs gap being reduced. Recently a US "fiscal cliff" deal has been reached, this should bring some certainty to the US market for the next two month as did improvements on job figures. However as with all bull runs, slight corrections can happen from time to time (see green). With indicators showing overpriced and momentum hitting near ceiling levels for the time being, it is getting difficult to foresee the bull going higher any longer. Thus the creation of 3 support lines: 1680, 1670 and 1655. I am expecting 1670 to hold the line. For the next quarter Q1'2013 expect KLSE to remain in high ground as  general election is looming around the corner. 
The KLCI's top 30 is made up of 50% GLC controlled by Khazanah, EPF, PNB and etc..they take turns selling and buying each other and propping up the index as they wish. Come on it's election year, the index always goes up to record high at these cycles. The star indicates when the Malaysian General Election was held. Take note that the index was never near the bottom when election is called. So don't worry too much on your investment because the government will instruct these GLCs to give us all THE FEEL GOOD FACTOR but make sure to monitor your portfolio once the election concludes.

Notes
*Supermx: First Interim Tax Exempt Dividend of 4%
*Jobst: Third Interim Single Tier Dividend of 1.75 sen per ordinary share
*Freight: Single Tier Final Dividend of 2.5 sen per share

Comments
#1 Supermax and Genting continues to market outperform and is still a bargain. See my previous two postings.
#2 Sold JOBST for RM2.25 after ex-dividend date, overall a ~17% returns (plus previous dividends).
#3 Freight is on hold until it appreciates.
#4 Boustead is on hold due to correction in CPO prices now.
#5 Maintain buy on iCap due to huge stock price vs NAV price.
#6 Maintain buy on SIF as bond market would continue to do well when low interest rate is maintained.
#7 Portfolio did not meet target of RM132k for the YR2012. Target for YR2013 is RM146k and can only be met if both Supermx and Genting show good appreciation in value for 2013. It just becomes harder after missing last year's target :(

For the coming week, expect commentary on Jobst, updates on mREITS (with target price and rating for BSDREIT) and some bonus content on EPF investment scheme (mutual funds). Let's welcome 2013!!! Hoping for another awesome year with great returns! Happy new year folks.....

Disclaimer: The reports, analysis and recommendations in this blog are solely my personal views. I do not link to any investment body or company. As such, I will not be responsible of any of your investment decision. Consult your investment adviser or come to your own conclusions before making any investment decision.